Monthly Usage Calls
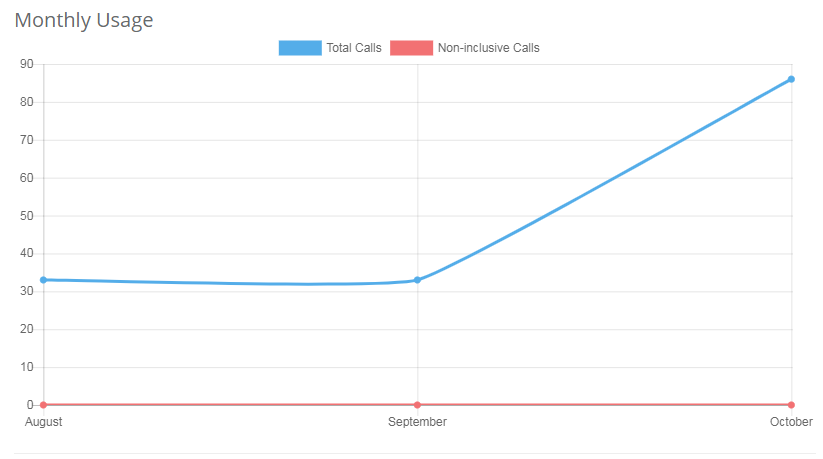
The Monthly Usage graph will show the total monthly usage per month for the last 12 months. The graph is a line graph, with the blue showing you the total calls made that month and the red showing you calls outside your agreed usage. Hovering over a data point will display more data.
Weekly Usage Calls
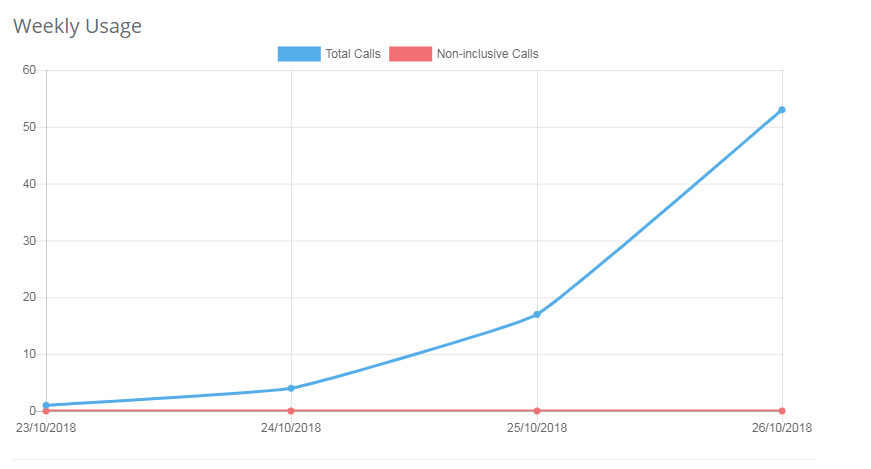
The Weekly Usage graph will show the same type of data as the monthly graph, however this will be a rolling breakdown of usage over the last 7 days.
Daily Usage
This pie-chart shows number of calls executed on the day split between the different available web methods.